Friday, September 27, 2013

Remote Sensing & Photo Interpretation, Mod5a: Intro to ERDAS Imagine & Digital Data 1

This week we were introduced to ERDAS Imagine, which is an image processing application.  I've been seeing it on my eLearning Desktop for a while now and now we're finally diving into it.  This week was a basic run-down of how to use the application.  Menu bars, sub-menus, how to create a subset of an image.  Unfortunately, the program still seems to need some work because we needed to export our subset image to ArcMap in order to add the finishing touches.  I am hesitant to get excited about a program that might crash often.  That just seems like a lot of frustration.  However, I suppose, in the long run, it'll be good to have at least a basic understanding of what it has to offer.

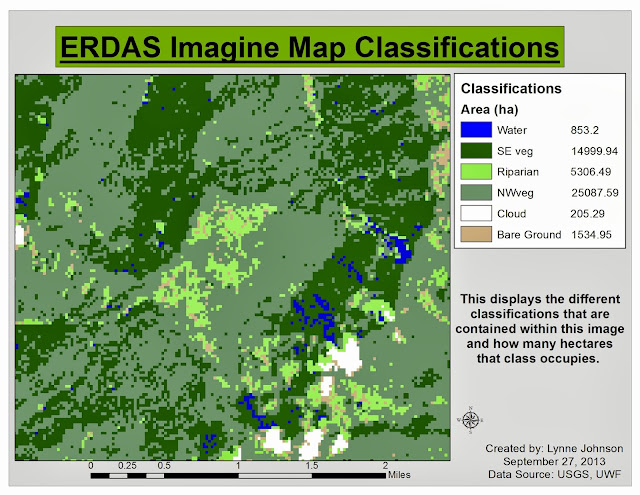
Below is the subset image we transferred from ERDAS Imagine to ArcMap.  It's a classification map showing how many hectares are occupied by that certain class.  It's a basic map but it involved some learning in ERDAS, which was the point.

Each classification is color coded and labeled with the number of hectares it occupies.

Thursday, September 26, 2013

Special Topics, Week 5: Network Analysis - Prepare Week - Hurricane Evacuation Routes

We started a new project this week leaving statistics in our dusty, messy path.  This week was the "Prepare Week" for our project on Network Analysis.  The scenario is such that the City of Tampa Bay has requested evacuation routes for the areas that may be affected by flooding due to an impending hurricane.  It was also requested that we provide routes for FEMA to aid stations.  To begin, a basemap was needed.  In order to create the map below, a raster file of the area (DEM) was converted into a polygon (vector) file.  I enjoyed learning about this process and how it can be utilized.

By doing so, we were able to select the areas that had an elevation of less than 6 feet.  These were to be considered "Flood Zones" and are identified in the map as a pink color.  Once the flood zones were established, the roads needed to be sorted out as to whether they'd be closed due to flooding.  By utilizing a "Search by Location," we located the roads that fall within these areas of concern and labeled them with a "1" in a newly created field in the attribute table, Flooded.  Some interstate highways fall within those areas, however, will remain open.  To identify those highways, a "Search by Attribute" was performed and we labeled those with a "2" in the Flooded field.  The roads in the non-flood zones were also given a label of 2.

Once a final map was produced, a map package was created, metadata was exported and a professional email was written.  The idea of this was to pass on this project to someone else.  In the real world, others may need to pick up a project where I left off.  This allowed us to see how the process would work and the best way to approach it.    

This map shows the location of 'Flood Zones' in Tampa Bay, FL as well as the locations of possible emergency aid and shelter.

Friday, September 20, 2013

Remote Sensing & Photo Interpretation, Mod4: Ground Truthing & Accuracy Assessment

Following last weeks creation of the Land Use Land Cover map, we continued this week with ground truthing.  By using Google Maps satellite view, we were able to verify out initial LULC assessments.  By randomly picking 30 sample points and creating a new shapefile we compared the codes we provided last week to what that land use/land cover actually was.  It was cool to see the differences.  Areas where I generalized as "Residential" often times had various community buildings dispersed throughout.  After staring at this image for so long last week, it was nice to get down into "Street View" on Google Maps to actually see what was going on.  I enjoyed this lab.


Ground truthing on my LULC map. 70% accuracy.

Above is my LULC map with my 30 randomly selected spots.  The green dots represent accurate code classification, while the red dots represent locations that were not accurate.  After all 30 sample points were verified, an accuracy assessment was done.  This map is 70% accurate.

Wednesday, September 18, 2013

Remote Sensing & Photo Interpretation, Mod3: Land Use/Land Cover Classification Mapping

This week in lab we learned more about Land Use/Land Cover classifications and how to map them.  We were provided with a digital image of Pascagoula, MS.  We were required to identify and label the land use and land cover of the entire image.  We did this by using the Editor tool and creating new features (polygons) and then editing the correlating attribute table with the classification codes and descriptions.  

As you can see below, there are a variety of uses and land covers just in this small image.  They range from residential areas to bays and estuaries.  We did this solely on visual interpretation.  Each classification is labeled with the appropriate numeric code and a color differentiating it from one another.  
Land Use Land Cover classification map of an area in Pascagoula, MS.

Wednesday, September 11, 2013

Special Topics, Week 3: Stats Analyze Week - Meth Labs

This week in lab we preformed an Ordinary Least Squares Regression Analysis.  This was done to identify and remove certain socio-economic variables that don't have a strong connection to the meth lab density.  The area of focus was Charleston, West Virginia.  Using specific measures, variables were removed to increase the Adjusted R-Squared value, or the accuracy of the model.  

This OLS Table displays variables that affect where a meth lab might occur.
This combination of variables resulted in an Adjusted R-Squared value of .727.
After running the OLS tool various times (about 22 times), I settled on these variables.  The above table displays the list of socio-economic factors which I thought were relevant to where a meth lab might be located.  Based on the Jarque-Bera statistic, my model does not appear to be biased.  

Next, we displayed this data in a map.  Below is a map of the study area with the results of my OLS.  The areas in yellow have a standard deviation of between -0.5 and 0.5 which means that it is an accurate prediction.  As you can see, other areas were over predicted while some were under predicted.

This map shows the resulting standard deviations.  The census tracts with a std value of
between -0.5 and 0.5 are accurate predictions of the number of meth labs in those areas.


Thursday, September 5, 2013

Special Topics, Week 1 & 2: Stats Prepare Week - Meth Labs


This week was our first week of work in my Special Topics course.  First we had to manipulate some data within an attribute table.  This data contained information from two counties in West Virginia and were related to several Methamphetamine labs that were busted in the area between 2004 and 2008.  

We also had to create a base map of the study area.  It was kind of up to us as far as what's displayed in it.  I decided to display a basic outline of the study area and show the meth lab concentration.  I also provided an inset map to give reference to where in WV these two counties were located.

Base map of study area for meth lab distribution study in Charleston, West Virginia.

Finally, we had to start a report that will accompany this study.  We had to write an introduction about the drug, Methamphetamine and provide some background information about the study area and the data we'll be looking at.  I'm intrigued to see how this report will turn out in the coming weeks.

Wednesday, September 4, 2013

Remote Sensing & Photo Interpretation, Mod2: Visual Interpretation

For the second week of this class, we took a look at some aerial photographs.  The first exercise was to focus on tone and texture.  We were to identify various areas in the photo depicting 5 different levels on both tone and texture.  They are identified by color and then labeled by their varying degrees.  

Identifying various forms of tone and texture in an aerial photograph.
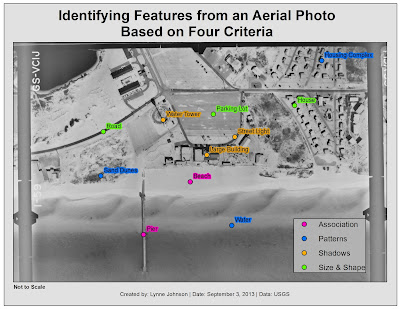
The second part of this exercise was to determine what things were in an aerial photo based on four different criteria.  They were: Association, Patterns, Shadows and Size & Shape.  We identified three in each category and two in the Association category.  Each category is designated by a different color.

Identifying features in an aerial photograph based on different criteria.