Thursday, February 28, 2013

Group Participation Project: ArcGIS Online


Final Summary for Group 5 – Arab States
This group project focused on creating a World Heritage Site map gallery for Zone 5, the Arab States. These sites include: Tyre, Lebanon; Tipaza, Algeria; Socotra Archipelago, Yemen; Petra, Jordan; Memphis, Egypt, Ksar of Ait-Ben-Haddou, Morocco; Hatra Ruins, Ninawa, Iraq; Carthage, Tunis; Thebes, Egypt; and Leptis Magna, Libya.
By assigning a group project, students learned the communication, organizational, and teamwork skills that are required in every day work life. This project also taught students new skills pertaining to GIS by: learning to use geographic clues via photographs to determine site locations, using coordinates to locate sites on a map, and to create a group gallery on ArcGIS Online.
The online program that we used to show our individual maps is called ArcGIS Online. On this site we created our maps to show where our World Heritage Sites are located. This program allows you to add members to a group, and by having access to that group, you can create and share maps. You can also choose to share your maps with the public or keep them private. Adding tags to your maps allows you to pull up anything that relates to that particular tag.
Currently we have 11 World Heritage sites listed. When you visit our sites, you will see different landscapes from one site to the next along with their histories. Click on the heading of the map you want to view and see the description page. You then have a choice to view a larger version of the map by clicking on the small picture map. When you are viewing the larger portion of the map, you should be able to locate and zoom easily to the World Heritage site by choosing a bookmark tab or choosing one of the headings.

ArcGIS Online Group Link for Group 5 is here.


Screenshot #1: Group 5 Gallery


Screenshot #2: My Map


 The World Heritage Sites assignment enabled our group to utilize skills conducive to the accurate portrayal of specific landscapes, cultural and architectural patterns and coastal morphological features. The group shared our framework, worked as a team, and completed a project within specific time constraints. Several tools such as base map applications, creating editable layers and the ability to measure helped our group accomplish this. Those tools helped us create our maps. Our maps also include tags, bookmarks for zooming, URL’s, titles and site descriptions for further resources on our World Heritage sites. The greatest lesson learned from this project was the ability to share knowledge, experiences and resources through real-life examples in a real-life setting.

Resource List:

Source 1: Wikipedia - This site provides an overview of the site and its history.  It also provides photos of the area relevant to this assignment.

Source 2: United States National Geospatial-Intelligence Agency. GEONet Names Server. 1994. Web 19 Feb 2013. < http://earth-info.nga.mil/gns/html/index.html> Provides the coordinates in decimal degrees for the Arab locations.

Source 3: UNESCO World Heritage Site: This website has information on all of the assignment locations and provides background on the site and where it is located globally.

Carthage, Tunis:  Provides an overview of Carthage including its history as a trading empire spanning the Mediterranean, and was, according to UNESCO, "home to a brilliant civilization." The city was destroyed in 146 BCE in the Punic Wars at the hands of the Romans.

Hatra, Iraq: Provides an overview of Hatra including its history as a large fortified city under the influence of the Parthian Empire and capital of the first Arab Kingdom.

Ksar of Ait-Ben-Haddou, MoroccoProvides an overview of Ksar of Ait-Ben-Haddou including its history as a preserved fortified city on the caravan route between the Sahara and Marrakesh in Morocco.

Leptis Magna, Libya: Provides an overview of Leptis Magna, including its history as an ancient Roman City with imposing public monuments, harbor, market-place, storehouses, shops and residential districts.

Memphis and its Necropolis (Pyramids of Giza):  Provides an overview of Memphis including its history as the capital of the Old Kingdom of Egypt and one of the 7 wonders of the world.

Petra, Jordan:  Provides an overview of Petra including its construction as half-built, half-carved into the rock, and surrounded by mountains riddled with passages and gorges.

Socotra Archipelago:  Provides an overview of Socotra including the universal importance because of its biodiversity with rich and distinct flora and fauna.

Thebes, Egypt:  Provides an overview of Thebes including its history as the capital of Egypt during the period of the Middle and New Kingdoms.

Tipasa, Algeria:  Provides an overview of Tipasa, including its history as an ancient Punic trading-post conquered by Rome and turned into a strategic base for the conquest of the kingdoms of Mauritania.

Tyre, Lebanon:  Provides an overview of Tyre including its history as a Phoenician city ruled the seas and founded prosperous colonies such as Cadiz and Carthage.

Nubia, Egypt: This outstanding archaeological area contains such magnificent monuments as the Temples of Ramses II at Abu Simbel and the Sanctuary of Isis at Philae, which were saved from the rising waters of the Nile thanks to the International Campaign launched by UNESCO, in 1960 to 1980.

Tuesday, February 26, 2013

Cartographic Skills, Lab 7: Choropleth Mapping

Choropleth map in grey scale

Choropleth map using color

This week we focused on Choropleth mapping.  A choropleth map is a type of map that presents it data grouped into classes with each class being a different shade or color.  These maps are useful when there are abrupt changes at boundaries.  I created two different maps to portray the data.

In the first one, I used a grey scale to show the United States' population change by the divisions with, which we were provided.  The data was gathered by the U.S. Census in 2000.  The second map that I made is the United States' population change based on each individual state.  In this case, I used color to define how much each state has changed compared to the rest of the country.

Tuesday, February 19, 2013

Cartographic Skills, Lab 6: Typography Methods


This is a map of Marathon, Florida, which is located in the Florida Keys.  This weeks lab was a lesson in Typography and how to label properly.  Starting with a basic boundary map, I had to locate, identify and label 17 different places.  These included a park, an airport, harbors, cities, various keys surrounding Marathon, a country club and Florida Bay.  Using what I learned from the readings and provided material, above is the map I created.


Intro to GIS, Lab 6: Map Projections (Pt. 2)


This map was a doozy! By far, this was the most difficult map I've had to create in this course so far.  It took a lot of time and required a lot of work.  This time, we had to gather our own data from various sources and reprojected each file into the correct spatial reference system.  It was a very time consuming process.  As you can see (hopefully), it is a map of the location sites of the petroleum storage tank contamination monitors.  I choose two quads located in southern Escambia county (see Escambia Overview inset map), gathered all the data and reprojected it to create this map.

Tuesday, February 12, 2013

Cartographic Skills, Lab 5: Map Composition


This is an example of a choropleth map of Southern Florida using data collected by the US Census in 2000.  It depicts the percentage of Hispanics in each county, differentiated by color.  There are two inset maps available to give you national and state perspective.  The map was created with ArcMap and final touches and layout was created using Adobe Illustrator.     

Intro to GIS, Lab 5: Map Projections (Pt. 1)


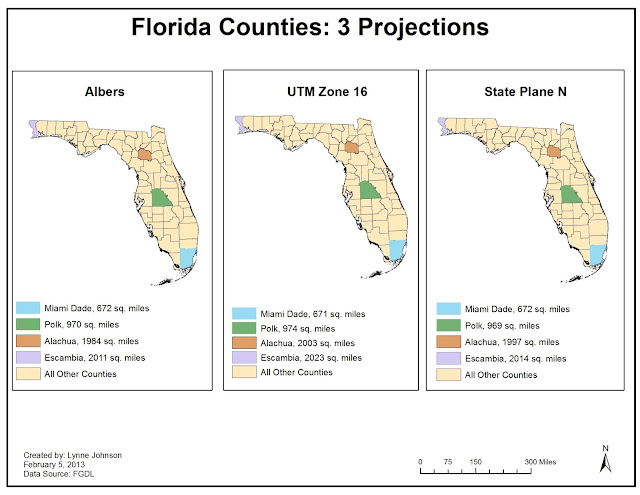
This is a map using three different map projections.  You can see major differences by the changes in square mileage in each of the four counties.  One subtle difference is the angle at which the maps are displayed.  They are slightly different.  The three different map projections used in this case are Albers, UTM Zone 16 and State Plane N.

Tuesday, February 5, 2013

Intro to GIS, Lab 4: ArcGIS Online & Map Packages

In this weeks lab, we were introduced to ArcGIS Online and Map Packages.  Here we learned to create and share map packages with the world!  Map packages makes things easier when you're trying to share your information either via the web or in a presentation.  These tools will definitely prove to be useful in the future, especially with potential jobs.  We also learned the differences between map packages (MPK's) and tile packages (TPK's).  Map packages usually include .mxd's and .pfd's.  Tile packages are used to share base maps (in tiled sections).  The greater the detail of the base map, the more tiles and vice versa.  Tile packages also store rasters better.  The instructions were highly detailed and easy to follow.  One suggestion I might have is to have all the instructions in one place rather than part of them on eLearning and the rest on ArcGIS Online.

Cartographic Skills, Lab 4: Adobe Illustrator


This weeks lab was a very basic introduction to Adobe Illustrator and how it can provide us with additional fine-tuning to maps, which we create in ArcMap.  ArcMap does provide us with a wealth of options and data tools, however, Adobe Illustrator takes us to the next level of details and artistic flare.  The above map is pretty standard.  I added a background color to give it a bit more draw.  During this lab, I really just focused on learning the tools in AI and how to manipulate them.  I can see how using AI in the aid of ArcMap, can definitely provided a cartographer with a lot more options and design variety.