
This first map is a basic map of the country of Mexico. From it, you can see the populations of each individual state. They are all labeled clearly and the legend helps you establish meaning to the different colors. Some key points that I took away from this map were how to label individual states and how to pick a useful color ramp.
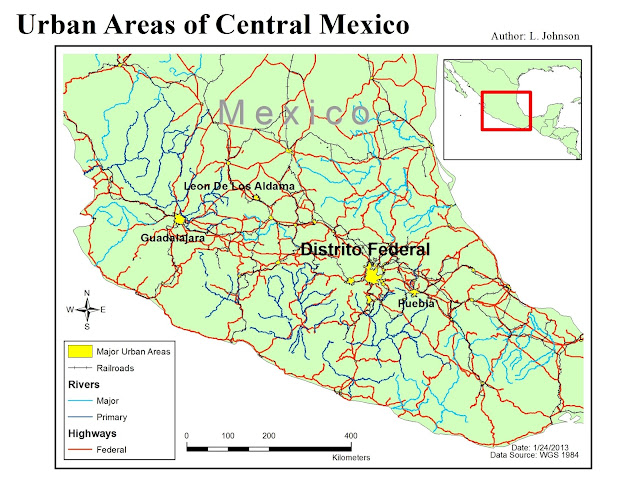
This second map zooms in to central Mexico and focuses on some different features. Here you can see the major urban cities of central Mexico along with the railroad system, rivers and main federal highways. Each feature is labeled with a color based on the cartographic appropriate symbology color guide. The inset map allows you to see what part of Mexico we are zoomed into and provides a good worldly reference. For some reason, I had a rather difficult time trying to isolate the major urban city labels. However, with trial and error and the help of fellow classmates, I was able to figure it out.
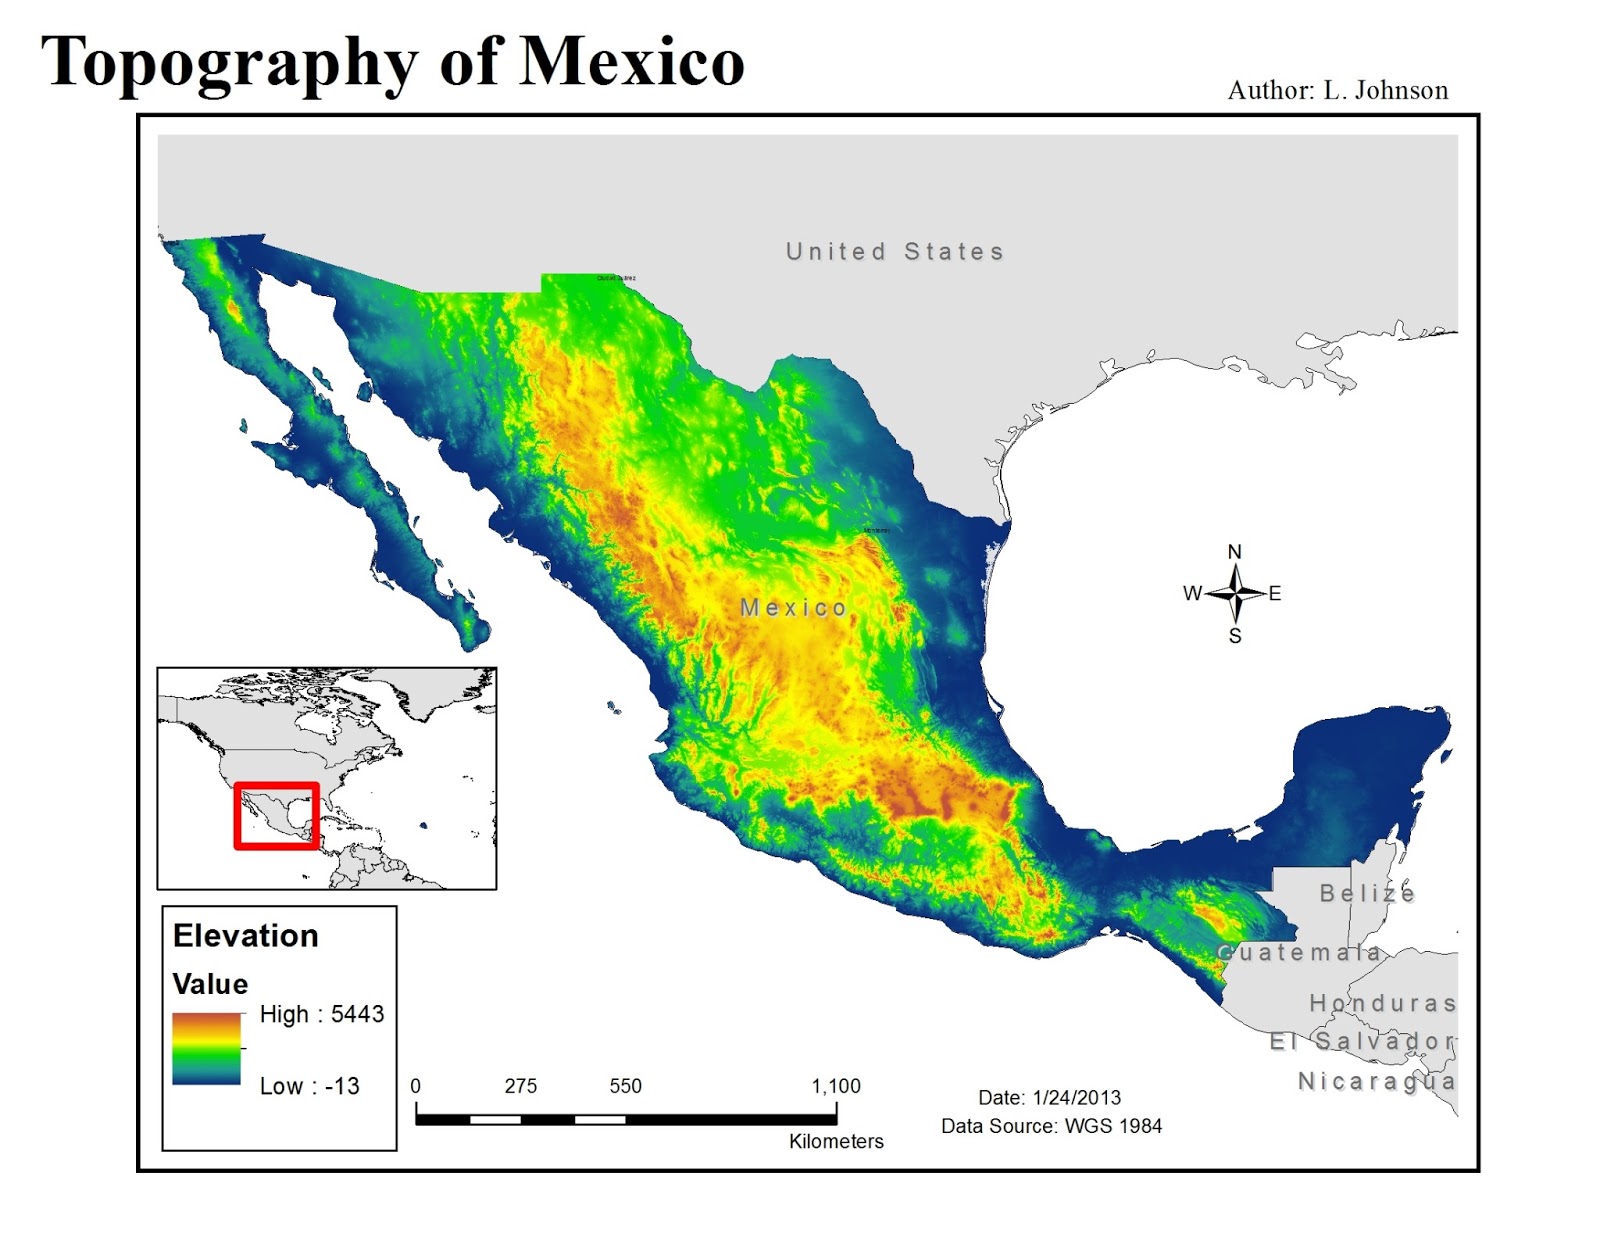
This last map is a topographical map of Mexico. Based on the color ramp that I've selected, you can see the different elevations throughout the country. As you can see in the legend, the darker the color, the lower the elevation and vise versa. I provided an inset map to give you a reference as to where in the world we're looking, in case one is unfamiliar with Mexico's locale. While working on this map, I learned the differences between a stretched symbology scheme and a classified symbology scheme.
No comments:
Post a Comment