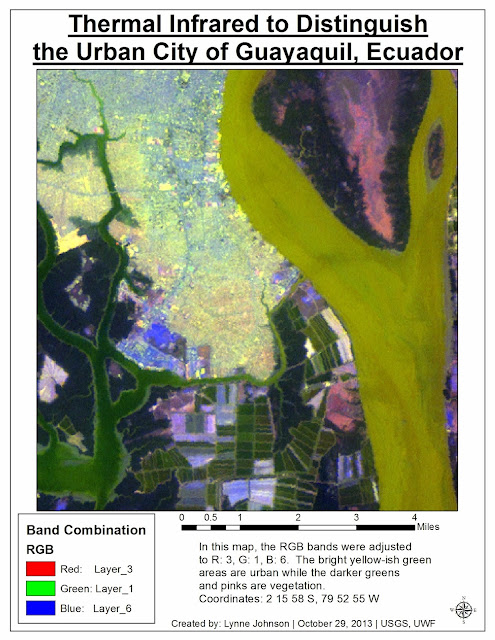
For this lab, I utilized both ERDAS and ArcMap to combine several layers of imagery into one single multispectral layer. In order to get my specific feature, the city of Guayaquil, to stand apart from the rest of the image I needed to find the right band combination. By working in ERDAS and ArcMap, I was able to fool around a bit with the bands and histograms until I found a combination that I liked. This combination then needed to bring out the urban areas of the city and provide an obvious distinction between urban and vegetation, agricultural and even the river.
I think my final combination of R: 3, G: 1, B: 6 and adjusted breakpoints really creates an image that allows you to see the urbanized areas of Guayaquil, Ecuador. These areas appear as a bright yellow-ish green color which contrasts nicely with the dark greens, blues and pinks of the other parts of the land. This also allows the river to be a lime color with a smooth and constant texture.
 |
| Urban areas of Guayaquil, Ecuador using the band combination of R: 3, G: 1, B: 6. |
No comments:
Post a Comment